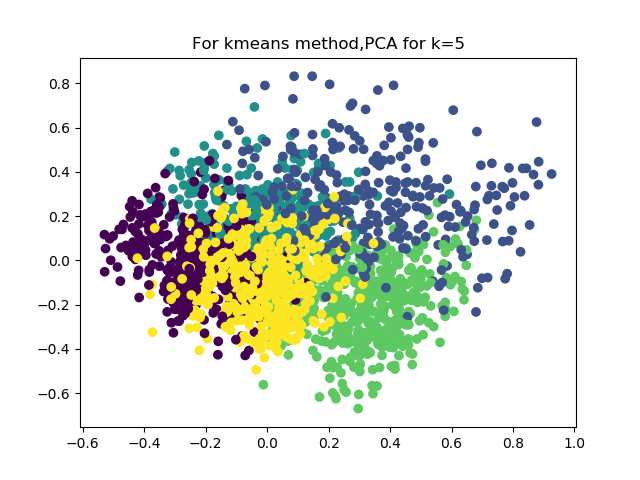
K-means partition all the observations into 5 clusters in which each observation belongs to the cluster with the nearest mean. We calculated the proportion of each sector’s stocks that belong to each cluster, then concluded 4 clusters. However, after calculating the mean of their beta, average volume level and year change level, there is no obvious similarity between those sectors in the same cluster.
Hierarchical
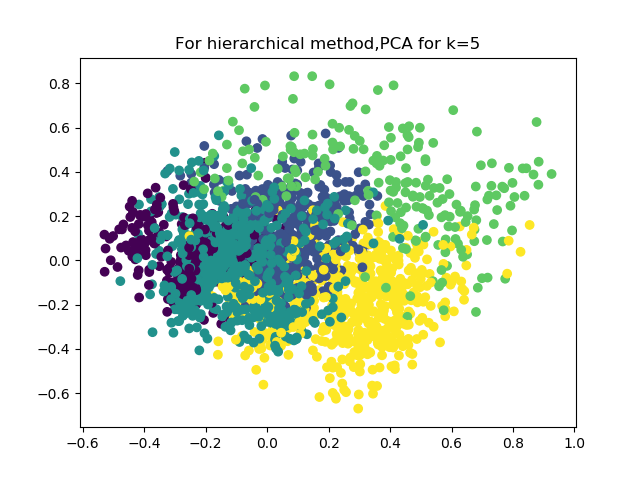
We adopted hierarchical clustering to build a hierarchy of clusters, and it also gave us 4 clusters. The right graph looks like the clusters made by k-means. Also, there is no obvious similarity can be found for the sectors in each cluster. Moreover, there are lots of points overlapping others and we cannot see a clear groups from the graph.
By-Hand Method
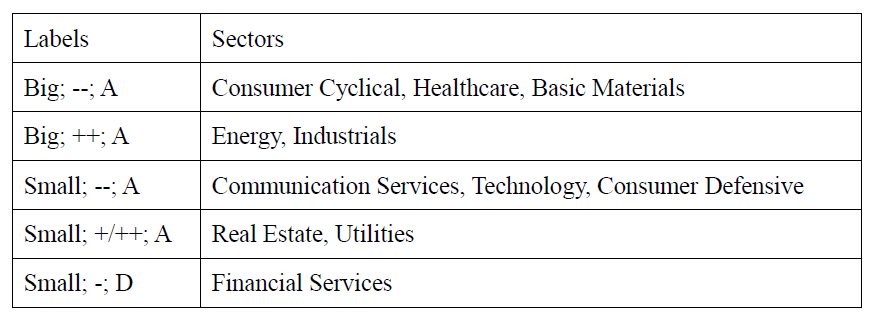
Since the first two methods do not give us an accurate answer about the similarities among different sectors, let’s look at the results of by-hand method. Surprisingly, we can see that consumer defensive(discretionary) and technology belong to the same group which is consistent with the fact in the introduction that these two sectors perform better. In addition, financial services itself belongs to a group, which may reflect that financial services performs differently from any other sectors. It is also in accordance with its high volatility.
Agreement by computational method & manual method
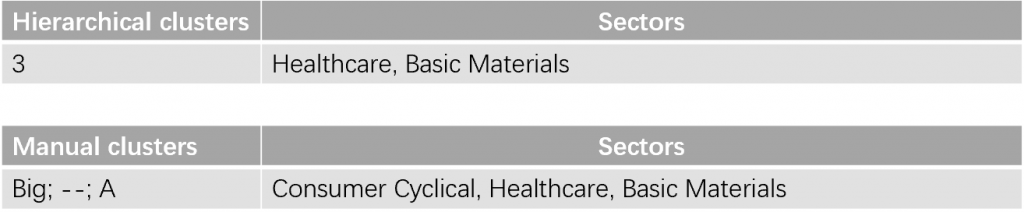
Although there are differences between k-means, hierarchical method and by-hand method, there is an interesting similarity. We noticed that healthcare and basic materials belong to the same class for both hierarchical method and by-hand method. We found that healthcare and basic materials do share some similarities, for example, most stocks in these two sectors are both be considered risky which means their beta coefficient is greater than 1; most stocks in these two sectors are both have negative year-to-date change of stock price and most stocks in these two sectors have top 25% average total volume in the whole market.
We can see that all of them gave some results. In the next step, we compared them and made a final choice.
fig.4-1
Which one we pick and why?
We decided to take the groups from by-hand clustering as our final results. Manual clusters are created directly based on their category in each variable. It is easier to observe similarities and patterns. For example, if a stock has small risk and small volume, then it is very likely to have negative growth, then it is better for people not to invest it.
We think about the reasons why computational clustering is not as good as the manual one. First, sector size differs from each other, which is not good for computational clustering; secondly, k-means and hierarchical both focus on the calculation of distance between each stock about risk, average total volume and year to date change, so it attaches great importance of the combination of those three variables. However, we are supposed to put more attention on the entire sector’s performance for each of variable. Therefore, by-hand method is more reliable since it takes the entire sector’s performance into consideration.